Heathkit IT-3121 Curve Tracer · Volume 4
Heathkit IT-3121 — Vol 4: Using It — Procedure, Reading Curves & Safety
Wire up a scope, and read gain, breakdown, and matched pairs off the glass
This volume is the operating log: how to wire the IT-3121 to a scope you already own, bring a device up safely, and read gain, saturation, output resistance, breakdown, and a matched pair off the graticule. Vol 1 covers what the instrument is and where it sits in the Heathkit line; Vol 2 covers the stepped-drive / swept-supply mechanism that draws the picture; Vol 3 covers servicing a 40-year-old unit and Dave Erickson’s modern clone. Here the assumption is a working unit, a scope, and a device on the bench.
4.1 Safety first — this is mains gear with a real high-voltage supply
Read this before anything gets plugged in. The IT-3121 has no CRT of its own, so there is no picture-tube EHT supply to fear — it outputs X and Y on banana jacks to an external scope. Do not let the absence of a scary-looking tube lull you. The collector sweep supply is a genuine hazard: it is a two-range supply that reaches ±200 V (on the 200 V / 200 mA range) and can deliver up to 1 A (on the 40 V / 1 A range). Either range puts hazardous energy on the device-under-test terminals and inside the case. Treat it with the same discipline as any tube-era mains instrument.
- The DUT terminals are live. With the collector voltage advanced, the socket contacts and the device leads can sit at up to 200 V. Never change a device, touch a lead, or probe the socket with the collector voltage up. Build a single reflex: turn the collector-voltage control fully down to zero, then touch anything. The current range compounds this — on the 40 V / 1 A range the voltage is lower but the supply will happily push an amp through a short (or a finger-to-lead path), and an amp is well past the let-go threshold.
- Filter capacitors hold charge after switch-off. The supply’s reservoir electrolytics can stay charged for a long time. Before opening the case: unplug it, wait, and confirm the reservoir caps are actually discharged with a meter before reaching in. Verify the bleeder resistor is doing its job — a 40-year-old bleeder that has gone open leaves the caps live indefinitely (this is exactly the population of parts Vol 3 recaps).
- Bring an unknown or freshly-recapped unit up on a variac. Ramp the mains slowly on a variac while watching current draw, as in Vol 3, rather than slamming a 40-year-old transformer and cap bank straight to line voltage.
- One hand behind your back for any live internal work, and keep the metal cabinet properly grounded through the mains earth.
None of this is exotic — it is the standard discipline for mains-powered vintage test gear, and it follows the hub bench rules in ../_shared/legal_ethics.md. The point worth internalizing is that the ±200 V / 1 A supply is easy to underestimate precisely because there is no CRT flyback transformer to remind you the box is dangerous.
4.2 Setting up the scope
The IT-3121 is inert until it has a display. It is the X-Y signal source; the scope is the screen. The instrument was designed for an analog scope but can also drive a digital scope in X-Y mode.
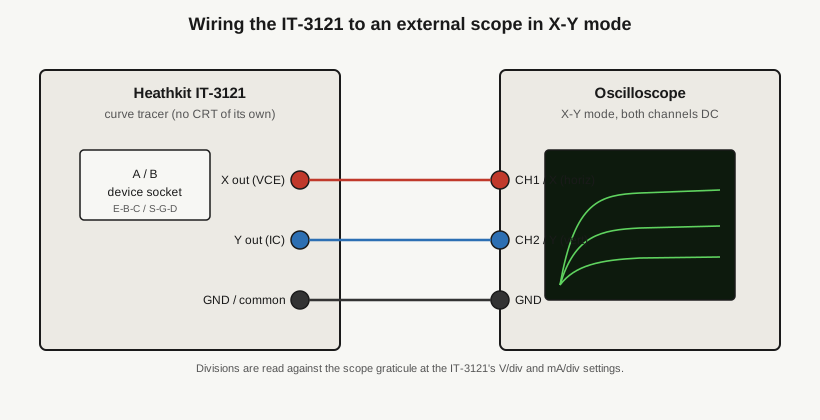
- Connect the IT-3121’s X output (collector voltage) to the scope’s horizontal / X input, and its Y output (collector current) to the scope’s vertical / Y input, using the panel banana jacks. Tie the grounds together.
- Put the scope in X-Y mode — channel 1 drives horizontal, channel 2 drives vertical, timebase off. On an analog scope this is a dedicated X-Y position on the timebase switch; on a DSO it is a display-mode menu setting.
- Set both scope channels to DC coupling and center the trace. With no device installed and the collector voltage at zero, you should have a single stationary dot at the origin. That dot is your zero reference — if it is not centered, position it before you install a device.
From here you read values against the scope’s graticule, but the scale of each division is set by the IT-3121’s sensitivity switches, not the scope’s own volts/div. Horizontal divisions are volts-per-division of VCE; vertical divisions are milliamps-per-division of IC. Set the scope’s own volts/div so the IT-3121’s output swing fills the screen, then treat each graticule division as the value the IT-3121 dial assigns it. Get in the habit of reading the two panels together: the picture is on the scope, the scale is on the tracer.
4.3 General operating procedure
A safe, repeatable sequence that works for any device class. The theme throughout is start cold, start small, drive up slowly.
- Start cold and small. Collector voltage to zero. Choose the lower 40 V / 1 A range unless you know the device needs the high-voltage range — most small-signal and power transistors live comfortably under 40 V, and staying on the low-V range means you cannot accidentally slam 200 V across a part. Set a large series load / current-limit resistor to cap current while you find your footing.
- Set the display polarity for the device: NPN or N-channel devices reflect into one quadrant, PNP or P-channel into the other. The whole family lands in the quadrant that matches the device’s sign convention, so set this before you expect the picture to make sense.
- Insert the device with the collector voltage at zero. Mind the pin assignment — E-B-C for a bipolar, S-G-D for a FET — into the A (or B) socket. Zero volts is not optional here; it is the rule from the safety section made procedural.
- Pick the step drive. For a bipolar transistor, choose a base current per step; the IT-3121 offers a 1/2/5 sequence from 2 µA/step up to 10 mA/step. Start modest — a few tenths of a mA per step for a small-signal part — and set roughly 5 steps. For a FET, switch to the gate-voltage step option, a 1/2/5 sequence from 0.05 V/step to 1 V/step, and set 5 to 10 steps.
- Set the axis sensitivities for the device class. A small-signal transistor wants a few mA/div vertical and a few V/div horizontal; a power transistor wants larger current/div. These are the IT-3121’s switches — they set what each scope division means.
- Advance the collector voltage slowly and watch the family bloom onto the screen. Trim the sensitivity switches so the curves fill the graticule without running off the edge. Keep an eye on how hard the device is being driven — watch the top curve’s current and back off the voltage if a curve is heading toward a current or dissipation the part will not survive. The IT-3121 will happily draw a curve right up to the point of cooking the device; the operator is the current limit of last resort.
- Read it (next section). Then zero the collector voltage before removing the device, closing the same loop you opened in step 3.
4.4 Reading transistor curves
For a bipolar transistor the family carries several independent numbers at once. Each feature of the plot maps to a device parameter.
4.4.1 DC current gain (beta)
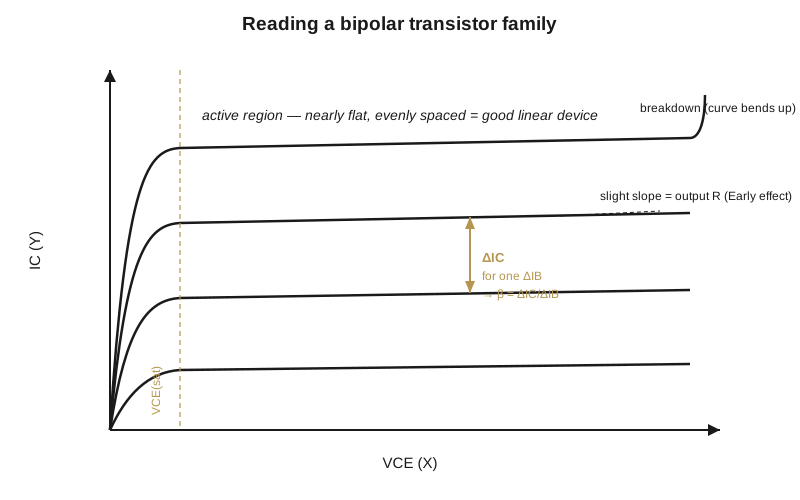
The vertical spacing between adjacent curves is the collector-current change produced by one base-current step. Because you dialed the base step in yourself, beta falls straight out:
β = ΔIC / ΔIB
Read ΔIC off the graticule (divisions × the mA/div you set), and divide by the base step per curve. For example, if adjacent curves sit two vertical divisions apart at 5 mA/div, that is ΔIC = 10 mA; against a 0.2 mA/step base drive, β ≈ 50. Even vertical spacing all the way up the family means constant gain — a healthy, linear device. Spacing that compresses at the top means gain falling off at higher collector current, which is normal for a part being pushed toward its limits but worth noting for a part that will run there. (This graphical β read is exactly the method Erickson’s clone reproduces digitally — his D44C9 power-transistor test, run at a 200 µA/step base drive, read beta ≈ 50 the same way; see Vol 3.)
4.4.2 Saturation voltage, VCE(sat)
The knee at the far left, where each curve turns from its steep near-vertical rise into the flat active region, is where the transistor is fully on. The VCE at that knee is the saturation voltage — read it off the horizontal axis. Smaller is better for a switch: a lower VCE(sat) means less dissipation when the device is hard on. A knee that has crept out to the right compared to a known-good part is a flag.
4.4.3 Output resistance / Early effect
In the active region the curves are not perfectly flat; the slight upward slope as VCE increases is the finite output resistance, the graphical signature of the Early effect. A nearly flat curve is a high output resistance (a good current source); curves that rise steeply, or fan out unevenly from one another, flag low output resistance, a weak part, or leakage. Comparing the slope against a known-good device is often more useful than the absolute number.
4.4.4 Breakdown voltage
Push VCE toward the range maximum and the top curve eventually bends sharply upward — collector current runs away as the junction avalanches. Read that breakdown voltage directly off the horizontal axis. This is where the two-range supply earns its keep: the 200 V / 200 mA range lets you find the breakdown of higher-voltage parts, while the 40 V / 1 A range keeps you away from 200 V for ordinary low-voltage devices. Approach breakdown gently — you are deliberately driving a device toward destruction, so advance the voltage slowly and back off the moment the curve turns up, unless you actually intend to read the breakdown to destruction.
4.5 Reading diodes and FETs
4.5.1 Diodes
A diode needs only a two-terminal trace — no step drive, so there is a single curve rather than a family. Forward-biased, you see the exponential turn-on knee and can read the forward drop at a given current straight off the axes. Reverse-biased, advance the collector voltage and push toward the reverse breakdown: an ordinary rectifier shows a sharp reverse knee at its rated reverse voltage, and a zener shows its knee right at the zener voltage — this is the direct way to confirm a zener’s voltage or find a rectifier’s reverse rating. The IT-3121 also handles tunnel diodes: the negative-resistance region shows as the curve’s characteristic backward fold, unmistakable once you have seen it. Watch the range — a zener above 40 V wants the high-voltage range, and pushing a rectifier to reverse breakdown is exactly the kind of test where the current limit matters.
4.5.2 FETs
FETs use the voltage-step generator rather than the current steps. For a JFET, sweep drain-source voltage while stepping the gate voltage (0.05–1 V/step) in the device’s off-going direction, and read the drain-current family: the pinch-off behavior, the saturation region, and the transconductance from the spacing between curves (ΔID per gate-voltage step). The saturation-region spacing is the FET analogue of the bipolar’s beta read.
Note the original’s hard limitation, carried from Vol 1 and Vol 3: the stock IT-3121 handles JFETs, not enhancement-mode MOSFETs, because its gate staircase only reaches the JFET’s polarity — a depletion JFET is characterized with the gate driven toward one sign, while an enhancement MOSFET needs the opposite polarity plus an offset the stock instrument does not provide. That gap is exactly what the TRX Lab breadboard op-amp mod (Vol 3) adds to a stock unit, and what Erickson’s clone builds in from the start. Do not expect a stock IT-3121 to plot a modern power MOSFET without that modification.
4.6 Device matching
One of the most valuable everyday jobs is picking matched pairs: two transistors with nearly identical curves for a differential input stage, or a complementary NPN/PNP pair for a push-pull output. The A/B device select makes this practical. Trace device A, note the family, then flip the switch to device B and overlay its family on the same graticule. Parts whose curves lie on top of one another — same knee (VCE(sat)), same vertical spacing (beta), same active-region slope — are matched.
For audio work this is the difference between a balanced output stage and one that quietly runs hot on one side; a differential pair with mismatched beta shows up as offset and drift. The same A/B overlay is also the everyday service move: pull a suspect transistor from a piece of gear and compare its family directly against a known-good part before committing to a repair — a mismatch in the knee, the spacing, or the slope tells you which one is out of spec, on the same screen, at the same scale.
4.7 Putting it together
The IT-3121’s whole value is that it turns invisible device physics into a picture you can read in seconds: gain from the spacing, saturation from the knee, output resistance from the slope, breakdown from the bend, and a match from an overlay. It asks for a scope you already own and a steady habit at the collector-voltage control — zero before your hands go near the socket, start on the 40 V / 1 A range, advance slowly, and respect the ±200 V the high-voltage range can deliver. In return it tells you not merely whether a device works but how well, which is the question that actually decides a repair or a matched-pair build.
For the mechanism that draws the picture — stepped base/gate drive and the two-range swept collector supply — see Vol 2. For what breaks on a 40-year-old unit and how Dave Erickson’s microcontroller clone rebuilds the same machine with relays, a DAC, and an OLED, see Vol 3. For the modern DIY semiconductor tracer that does the same job with current parts, see the VBA Curve Tracer.