uTracer NXT · Volume 3
uTracer NXT — Vol 3: Measurement Theory
Why pulse instead of holding HV continuously — and how the NXT charges, switches, and samples
3.1 The problem pulsing solves
Put a real operating point on a power tube — say 300 V at 100 mA — and the plate is dissipating 30 W. Hold that continuously across a full sweep of dozens of operating points and you need a bench supply that can source that power at up to the NXT’s 450 V default (500 V option), a heatsink to get rid of the heat, and a real risk of cooking the tube every time the sweep wanders past its rated plate dissipation, Pa,max. That is exactly the bulky, hot, expensive, and hazardous instrument the uTracer family was invented to avoid.
The physics that makes the escape possible is simple: a tube does not care whether you hold an operating point for a second or for a millisecond. The anode current at a given plate/grid combination (Va, Vg) is set by the fields inside the tube, which reach steady state far faster than the measurement window. So there is no need to hold the point. Establish it for just long enough to read the current, then let go.
Every uTracer, the NXT included, therefore establishes each operating point for a ~1 ms measurement pulse, samples the current at the end of that window, and disconnects. Average power is peak power scaled by duty cycle, and with a ~1 ms pulse fired only when a point is requested, that duty cycle is tiny. 30 W of instantaneous plate dissipation collapses to milliwatts of average heating. This one idea — pulse briefly, average low — is the whole reason a matchbox-sized kit can trace curves that would otherwise demand a rack of gear.
3.1.1 The duty-cycle bargain, with numbers
The bargain is worth quantifying, because it is the entire economic and thermal case for the instrument.
- A measurement pulse lasts about 1 ms (0.001 s).
- Between points, the boost converter has to re-charge the reservoir capacitors, which takes on the order of seconds (Section 3.1).
- So even a brisk sweep spends roughly 1 ms conducting per ~1 s of wall-clock time — a duty cycle near 10⁻³.
Run the earlier example through that: 30 W peak × 10⁻³ ≈ 30 mW average. Push to a genuinely abusive instantaneous point — 450 V at 350 mA, the NXT’s default current ceiling, is ≈157 W peak — and the average is still only about 0.16 W. The tube’s anode never sees more than a whisper of continuous heating no matter how aggressive the trace, because it is conducting for one part in a thousand of the time.
3.1.2 Why pulsing lets you exceed Pa,max safely
Plate-dissipation ratings are thermal limits. They describe how much heat the anode can shed continuously before it runs hot enough to outgas, warp, or in the extreme melt. Crucially, the anode has real thermal mass — its temperature responds to average power delivered over tens to hundreds of milliseconds, not to a single 1 ms spike. A millisecond slug of energy (power × 1 ms) arrives, spreads into the metal, and is gone long before it can raise the bulk anode temperature; then the tube sits cold until the next point.
That is why a pulsed tracer can legitimately probe operating points whose instantaneous power sits well above the tube’s continuous Pa,max — the curve you plot is the same curve the tube would follow in continuous operation, but the tube never accumulates the heat. The higher-voltage uTracer6 exploits this to its 1000 V / 1 A envelope; the NXT works the identical thermal principle inside its lower 450–500 V / 350 mA window (the HV switch itself is good to 1 A, leaving headroom above the 350 mA default). The theory is generation-independent — only the envelope changes.
3.2 Two pulses, two timescales — do not conflate them
There are two completely different “pulses” inside this instrument, separated by three orders of magnitude, and the distinction matters:
-
The measurement pulse — ~1 ms. This is the window during which high voltage actually stands on the tube and current is read. Dekker’s NXT log is explicit: a “1 ms measurement pulse in which the currents are measured.” This figure is standard across the entire uTracer family — the original uTracer already used “pulses of about a millisecond.” There is no earlier “microsecond-scale” measurement regime to contrast against; the millisecond pulse has been the family’s measurement window from the beginning.
-
The boost-converter switching pulse — tens of microseconds. This is the internal on-time of the switched-mode step-up converter that charges the reservoir caps (Section 4.1). It has nothing to do with how long HV is applied to the tube. On the NXT this switching pulse was widened from the uTracer3’s 24 µs to 29 µs to reach the higher plate voltages. It fires thousands of times to fill the cap, entirely during the multi-second charge phase, before the tube ever conducts.
The only microsecond numbers in this instrument belong to the DC-DC converter’s switching, not to the measurement window. When someone says “the uTracer pulses,” they mean the ~1 ms measurement pulse — the same figure on the NXT, the 3+, and the 6.
3.3 The three phases of a measurement
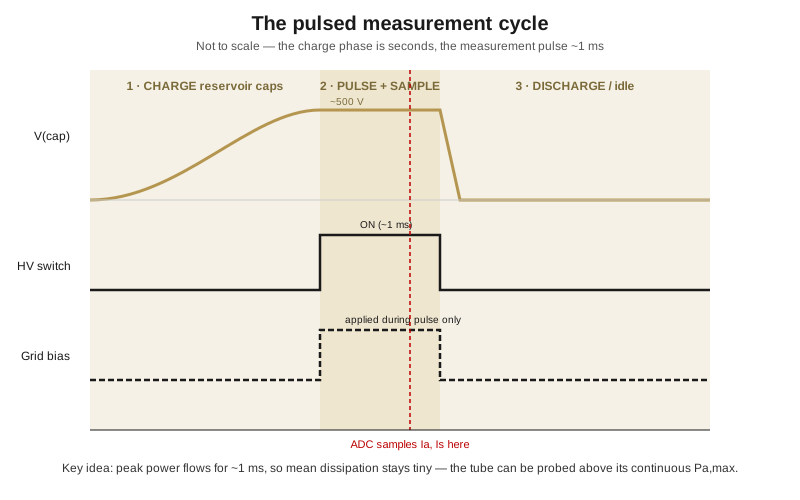
The timing diagram above shows one full cycle. It has three phases, and it is worth being precise about the timescales, because they span six orders of magnitude.
3.3.1 Phase 1 — Charge (seconds)
The plate voltage is not switched from a big supply; it is stored first. The boost converter (Vol 2) pumps its inductor in short bursts — the 24 µs → 29 µs switching pulses of the previous section — and ratchets charge into the reservoir capacitors until they reach the target plate voltage. The NXT carries two 100 µF reservoir capacitors (450 V range by default; the 500 V option requires higher-voltage-rated caps), one feeding the anode supply and one the screen supply, so anode and screen voltages can be set independently. Because the boost stage is small and the caps are large, filling them to several hundred volts takes on the order of a few seconds. Throughout this phase the tube is held cut off and sees nothing.
The stored energy is not trivial. Each 100 µF cap at 450 V holds ½·C·V² ≈ 10 J; at the 500 V option, ≈ 12.5 J. That is a genuine, potentially lethal stored-energy hazard that persists after power-down — the bench-safety rule (discharge the reservoir caps before touching the board, one hand off, never probe under power) follows directly from this number.
3.3.2 Phase 2 — Pulse and sample (~1 ms)
When the caps are charged, the PIC closes the high-voltage switch — the 700 V NMOS device carried over from the uTracer6 — to connect the charged anode cap to the tube’s plate (and the screen cap to the screen grid). Simultaneously the grid-bias amplifier is enabled, so the correct negative control-grid voltage is present only during this window. Plate and screen current now flow, drawn from the reservoir caps and returned through the sense resistors. At the end of the ~1 ms window the ADC samples the sense-resistor voltages; those captured values are the anode current Ia and screen current Is for this (Va, Vs, Vg) point.
3.3.3 Phase 3 — Discharge / idle
The HV switch opens, the grid amplifier is disabled, and residual charge on the switch’s parasitic capacitance and on the rails is bled off so the next point starts from a clean baseline. Then the cycle repeats for the next setpoint in the sweep, beginning again with a fresh charge phase.
3.4 Generating and switching the high voltage: the two-switch scheme
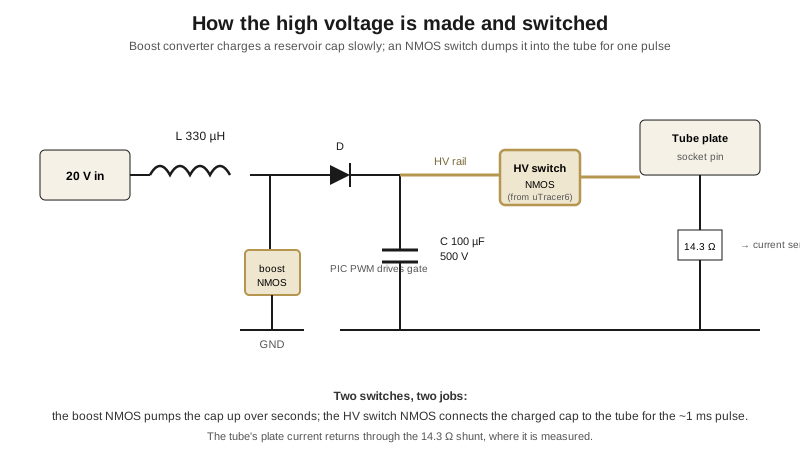
It is easy to conflate the two NMOS transistors in the design, so the figure above separates them. There are genuinely two switches doing two different jobs.
3.4.1 The boost switch
The boost switch lives inside the switched-mode step-up converter. Driven by the PIC’s PWM at its 24–29 µs on-time, it repeatedly grounds one end of the boost inductor; when it opens, the inductor’s collapsing magnetic field forces current through a rectifier diode into the reservoir cap, ratcheting the cap voltage up a little each cycle. Do this thousands of times and the cap climbs from a low-voltage input to several hundred volts. This is a boost (inductor-based step-up) converter, not a switched-capacitor charge pump — the energy store is the inductor’s field, and the reservoir cap merely holds the accumulated result. The same boost topology also generates the instrument’s −105 V rail.
3.4.2 The HV switch
The HV switch is the device that connects the already-charged reservoir cap to the tube for the measurement pulse. When open it must hold off the full plate voltage; when closed it must pass the plate current cleanly. This is precisely the job that used to fall to the MJE350 / KSP99 high-voltage PNP transistors — parts that have since been phased out (component obsolescence). The NXT inherits the uTracer6’s answer: a 700 V IPD70R360P7 NMOS switch, driven from a low-voltage gate drive, which Dekker reports has run in ~450 uTracer6 units “with no failures reported to date.” Its 700 V rating suits the NXT’s 450–500 V envelope with margin, where the kilovolt uTracer6 needs correspondingly higher-voltage devices. Choosing the lower voltage class deliberately is what lets the NXT stay on cheaper, current-production parts than the 6 while keeping the identical pulsed architecture.
3.5 Reservoir droop and how the NXT compensates
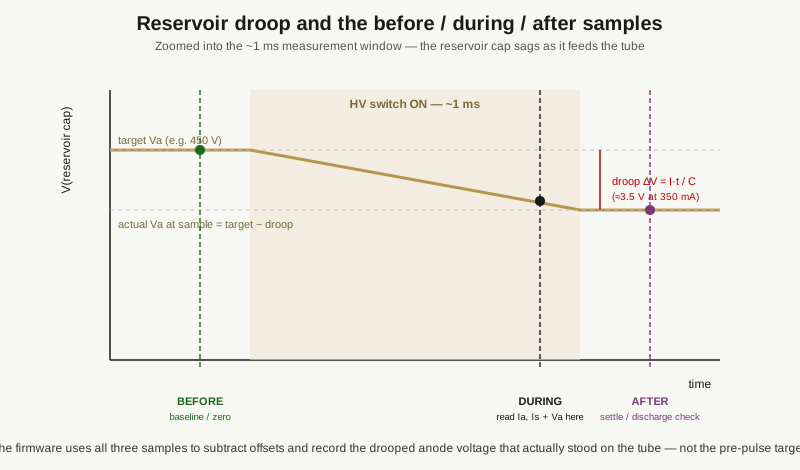
A reservoir cap feeding a conducting tube is not an ideal voltage source — it discharges as it delivers current, so the plate voltage sags over the 1 ms pulse. The sag follows straight from the capacitor law, ΔV = I·t / C:
- At 100 mA into one 100 µF cap for 1 ms: ΔV = (0.1 A × 0.001 s) / 100 µF = 1.0 V.
- At the 350 mA default ceiling: ΔV = (0.35 × 0.001) / 100 µF ≈ 3.5 V.
So at a 450 V setpoint the worst-case droop is under 1% — small, but not negligible when you are trying to plot accurate curves, and larger for high-current tubes. Left uncorrected, it would mean the “450 V” curve was actually taken at something closer to 446 V at the high-current end.
The firmware handles this by sampling the pulse at three instants — before, during, and after — with the built-in ADC. The pre-pulse sample fixes the zero/offset baseline; the during-pulse sample reads the true current and the actual, drooped anode voltage that stood on the tube at the sampling instant; the after-pulse sample confirms the switch has opened and the node is discharging as expected. Recording the drooped voltage rather than the pre-pulse target is what keeps each plotted point honest: the point is logged at the voltage that was really present, not the voltage that was nominally set.
3.6 Measuring Ia and Is: the sense chain
The current measurement is a chain, and each stage earns its place.
3.6.1 Shunt
Anode and screen currents each flow through a sense resistor — 14.3 Ω by default, the value that also sets the 350 mA current ceiling. Ohm’s law turns current into a voltage: 100 mA across 14.3 Ω is 1.43 V, a comfortable signal; 350 mA is ≈5.0 V, near full range; 1 mA is only 14.3 mV, and a microamp-scale grid or leakage current is smaller still. That six-decade span of signal is the reason the rest of the chain exists.
3.6.2 Zero-drift buffer and true-ground referencing
The shunt voltage is buffered by the MCP6V86 — a low-offset single-supply, 5 V rail-to-rail op-amp. That low offset is what makes the small currents trustworthy: a few millivolts of amplifier offset would swamp a milliamp-scale reading. It is exactly the property the obsolete OPA227 was chosen for, and exactly what its modern replacement had to match — the component-obsolescence problem that drove the whole redesign. Because the MCP6V86 runs from a single 5 V rail, a pull-down to the −105 V rail is used to achieve true ground referencing so the amplifier can resolve signals right down to zero.
3.6.3 Programmable gain — the PGA113
The buffered signal then passes through the PGA113 programmable-gain amplifier, which multiplies by a software-selected binary/decade gain factor so the signal fills the ADC’s input range whether the tube is drawing microamps or hundreds of milliamps. This is effectively an autoranging front end: the software picks the gain, records which gain it used, and scales the digitized result back to real current. The PGA113 replaces the earlier design’s fixed-gain OPA227 sense stage, and its software ranging is what gives the NXT clean dynamic range across that six-decade current span.
3.6.4 The 10-bit ADC and 1×–32× averaging
Finally the PIC16F884’s built-in 10-bit ADC digitizes the amplified voltage. Ten bits is 1024 counts — modest on its own, but it is 1024 counts per PGA range, and with the PGA supplying the range and the zero-drift buffer supplying the floor, the effective dynamic range is far wider than ten bits would suggest. To beat down noise, the firmware can average 1× to 32× — taking multiple pulses per point and averaging the readings, trading a little sweep time for a cleaner number. Combined with the before/during/after sampling of the previous section, this is what turns a 10-bit converter into a measurement worth plotting.
3.7 What one measured point actually contains
The output of a single pulse, then, is not just a current reading. It is a small bundle:
- the digitized anode current Ia and screen current Is, each read through its own shunt → buffer → PGA → ADC chain;
- the actually-achieved anode and screen voltages (drooped, not nominal), recovered from the before/during/after samples;
- the grid voltage that was commanded for the point;
- the PGA gain and average count in force, so the host can scale correctly.
The host software (Vol 4) converts that bundle back to engineering units using the calibration constants, and repeats the whole charge → pulse → sample → discharge cycle for every point in the sweep to build up a curve.
3.8 The NXT’s refinements to the pulsed scheme
The NXT does not reinvent the pulsed principle — it refines its execution around current-production parts:
- The 700 V NMOS HV switch from the uTracer6 replaces the phased-out MJE350 / KSP99 PNP switch, so the mainstream tracer inherits the kilovolt model’s field-proven reliability (Vol 2).
- A PGA-based front end (MCP6V86 buffer + PGA113 programmable gain) replaces the fixed OPA227 sense amplifier, giving clean software-controlled ranging built entirely from parts still in production.
- A pulsed grid-bias amplifier enabled only during the measurement window keeps grid-stage dissipation and fault exposure low, alongside a simplified rail scheme built around the +5 V logic supply and the boost-generated −105 V rail.
None of this changes the headline theory: charge slowly, pulse briefly, sample at the end, compensate for droop, and let duty cycle keep the tube cool. The generation-by-generation comparison in Vol 5 puts the 3+, the 6, and the NXT side by side; Vol 4 gets the kit built and calibrated so that the numbers coming out of this measurement chain can be trusted.