VBA Curve Tracer · Volume 1
VBA Curve Tracer — Vol 1: What the VBA Curve Tracer Is
Paul Versteeg’s open, fully analog semiconductor curve tracer, and where the name comes from
1.1 What it is, in one line
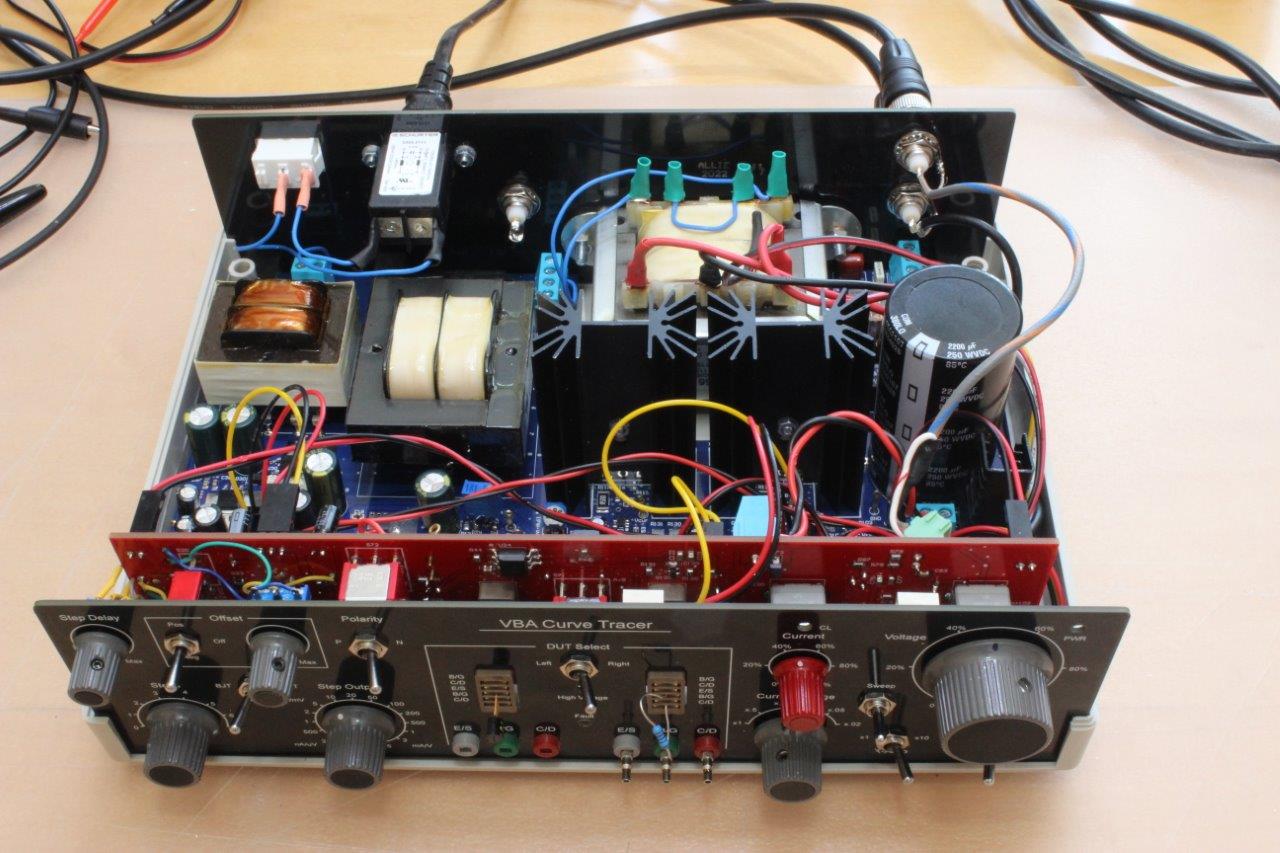
The VBA Curve Tracer is a home-buildable, fully analog instrument that draws the current-versus-voltage characteristic of a semiconductor part — a bipolar transistor, a diode, a FET, an LED, a Zener — as a live curve, or as a whole family of curves, on an ordinary oscilloscope running in X-Y mode. It is the modern, open-design answer to the classic bench transistor tracer: the Tektronix 575/576/577 iron and the Heathkit IT-3121. Paul Versteeg (“paulvee”) publishes the entire design — schematics, PCB layouts, bills of materials, build and calibration documents, and Gerbers — as a public GitHub project so anyone with a soldering iron and a scope can build their own.
State the defining fact plainly, because it shapes everything that follows: there is no microcontroller, no firmware, and no host or PC software anywhere in the VBA. Where the tube-tracer side of this bench (the uTracer6, uTracer NXT and eTracer) fires a high-voltage pulse and lets a PC plot the result, the VBA is a purely classical analog machine. Op-amps, an analog step generator, heat-sinked power-MOSFET pass devices and a bank of rotary range switches do the work; your oscilloscope is the display. That makes it a genuinely different beast from the tube tracers documented elsewhere in this Curve Tracers category, and a good teaching instrument, because every function corresponds to a knob you can see on the panel and a circuit you can follow on the published schematic.
The public write-up is dated June 2022, but the machine has a longer history. Versteeg built his first curve tracer prototype in 2017; the VBA is the Version 3 evolution of that work, refined across a series of 2021 build and measurement posts before the collaborative V3 design picked up its “VBA” name and went public.
1.2 Where the name comes from
Read nothing into the letters — “VBA” here has nothing to do with the Microsoft macro language. Per Versteeg’s own account and the GitHub repository, the name is a mash-up of the surnames of the three main contributors: Paul Versteeg, Bud Bennett, and Mark Allie.
- Paul Versteeg — blog “paulvee”, based in the Netherlands — is the originator. He built the original 2017 prototype and the core design is his; he drives the project and authors the documentation.
- Bud Bennett contributed to the circuit development — the analog regulation and control side of the design.
- Mark Allie did the EDA work: schematic capture and PCB layout, and the move of the design to mostly surface-mount parts for reproducible fabrication.
Two more names appear in the credits but are deliberately not part of the acronym: Matt Web and Cory Lytle, who caught part-number errors in the BOM and improved the installation and calibration instructions. Their fixes — along with community-reported protection and anti-oscillation tweaks — folded back into the released design, which is one of the practical benefits of publishing a design in the open.
1.3 The design philosophy: fully analog, scope-as-display
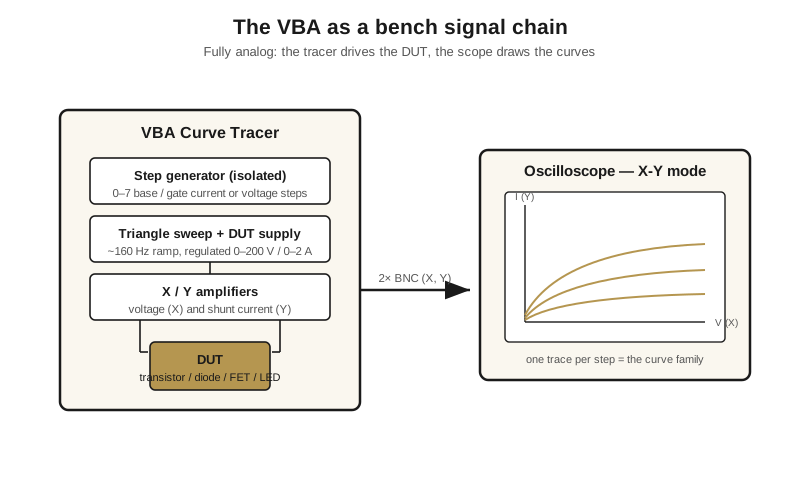
The single most important architectural decision in the VBA is what it leaves out. There is no processor to sample a waveform, no ADC/DAC pair, no USB link, and no application to install. The instrument is a pure analog sweep-and-step generator that produces two analog signals and hands them to a scope:
- an X signal proportional to the voltage across the device under test, and
- a Y signal proportional to the current through it.
Feed those into an analog CRT scope or a modern DSO set to X-Y mode and the beam plots the device’s I-V characteristic in real time. Versteeg used a Rigol DSO for the public write-up, but any scope with an X-Y mode works — the tracer does not care what draws the picture, and no software sits between the measurement and the screen.
This is a deliberate philosophy, not a limitation of ambition. Making the scope the display means the instrument’s whole job is to be a good analog signal source: clean sweep, quiet current sense, stable stepping, safe current limiting. All the display resolution, persistence, cursors and math you might want are already sitting in the scope you own. It keeps the build tractable for a home constructor, keeps the signal path honest and traceable end-to-end, and sidesteps the entire category of firmware bugs. The cost is real and worth naming: you must supply your own X-Y-capable scope, and the quality of the picture is bounded by that scope — at extreme sensitivity a noisy DSO input can wash out the lowest-level curves (Vol 4 returns to this).
1.4 Design goals
The stated motivation is squarely practical: build a proper curve tracer for the home bench, and in doing so bring curve tracers “back into the foreground” so a builder can verify a real device against its datasheet. A curve tracer answers questions a multimeter cannot — what a transistor’s gain actually is at a chosen operating point, how flat its output curves are, where it breaks down, whether two parts are close enough to call a matched pair. The design was made reproducible and thoroughly documented — full schematics, PCB layouts, BOMs, and build/calibration procedures published on GitHub — rather than left as a clever one-off.
The concrete goals that emerge from the write-ups:
- Cover real, useful operating envelopes, not just small-signal parts — hence ranges reaching 200 V and 2 A (detailed below).
- Be safe to the part under test. Curve tracing pushes a device toward its limits, and it is easy to cook a transistor. The VBA leans hard on adjustable current limiting and an adjustable per-cycle step delay to hold dissipation down.
- Be reproducible by a competent builder from published files, with verification and calibration procedures included.
- Use the scope you already own as the display, rather than adding a screen and the digital plumbing behind it.
- Benchmark against, not clone, the classics. The explicit target is to make “many of the measurements a Tektronix 577 (and 576) can make” at hobby cost — Versteeg is careful to say it is not everything a Tek 577 can do.
1.5 What it can trace, and what it measures
The VBA is built for two- and three-terminal semiconductor devices. In practice that covers a wide bench menagerie, and the published measurements exercise real parts from small-signal jellybeans up to power devices:
- Bipolar transistors (BJTs) — NPN and PNP, small-signal (e.g. 2N3904) through high-power (e.g. MJL3281A) — displayed as a family of output curves (collector current vs collector-emitter voltage, one curve per base-current step). From that family you read DC current gain (hFE/β), saturation voltage VCE(sat), the breakdown voltages BVCEO / BVCBO / BVEBO, and leakage currents (ICEO, ICBO and relatives).
- MOSFETs — enhancement-mode N- and P-channel (e.g. STW6N90K5, LP0701) — as a drain-current family stepped by gate voltage, giving the gate threshold VGS(th), the drain-source breakdown BVDSS, and on-resistance RDS(on) behaviour.
- JFETs — depletion-mode parts (e.g. 2N4391, BF256B) — for zero-bias drain current IDSS, pinch-off/VP, and VGS(off).
- Diodes, LEDs, Zeners and Schottky — forward-voltage knee against current, reverse breakdown, and leakage: an ordinary 1N4148, a Schottky 1N5819, a 10 V Zener read against its regulation current, and assorted LEDs whose different forward knees are exactly why turn-on voltage varies with colour.
- Composite and matched parts — Darlingtons, and matched-pair selection. The front panel carries a DUT Select switch and two device positions so you can flip between two candidates and overlay their curves to grade a match.
- Capacitor leakage — the tracer will also show the leakage current of a capacitor against applied voltage.
Vol 4 is the operator’s manual for reading all of these; the point here is the breadth of the envelope.
1.6 The operating envelope
The front panel exposes the operating vocabulary directly, one knob per function: Step Delay, Offset, Polarity, Steps, DUT Select, Current (with a current-limit indicator), Voltage, and Voltage Ranges. Behind those knobs are the numbers that define what the instrument can actually do.
1.6.1 Three DUT supply ranges
The main DUT supply — the swept voltage applied across the device and the maximum current it can deliver — is switchable across three ranges:
Table 1 — The main DUT supply — the swept voltage applied across the device and the maximum current it can deliver — is switchable across three ranges
| Range | Max voltage | Max current | Typical use |
|---|---|---|---|
| Low | 0–35 V | 0–2 A | Power BJTs / MOSFETs at real currents |
| Mid | 0–70 V | 0–1 A | Medium-power parts |
| High | 0–200 V | 0–100 mA | High-voltage parts, breakdown tests |
The three trade voltage reach against available current, and they nest: the 35 V range is narrow but tall (full 2 A), the 200 V range is wide but low (100 mA). The range is set by a front-panel Voltage Range switch (35 / 70 / 200 V) — a deliberate, chunky panel control rather than a software mode.
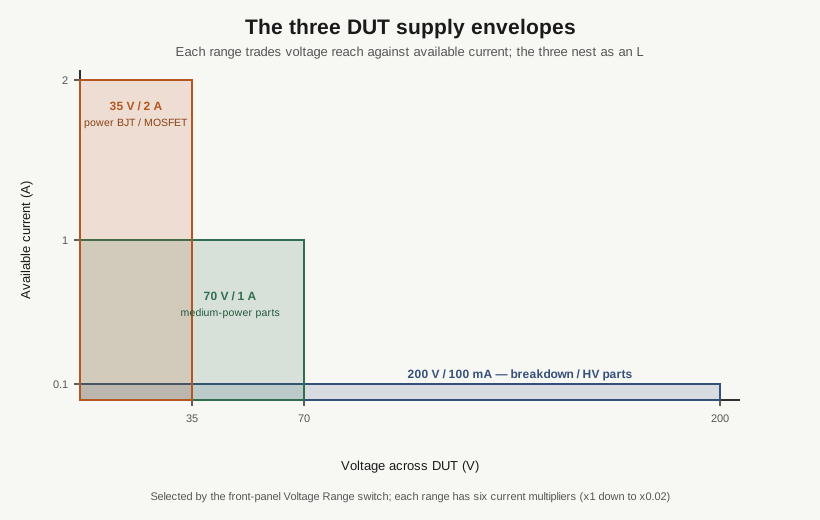
Within any range, the Current control provides six current multipliers — ×1, ×0.5, ×0.2, ×0.1, ×0.05, ×0.02 — so the vertical (current) scale can be dialled down to suit a small part without changing the voltage envelope.
1.6.2 The step generator
The three-terminal magic is the step generator, which drives the control terminal (base current for a BJT, gate voltage for a FET) in discrete steps so each sweep of the main terminal draws a different curve, and the stack of curves becomes the device’s characteristic family.
- 0–7 steps per sweep cycle — up to eight traces including the zero step.
- Step delay ~40–250 ms (adjustable), which pauses between steps to give the DUT thermal relief during sustained measurement — the practical defence against cooking a part while you study it.
- Step magnitudes follow a 1-2-5 sequence spanning a huge range, from 5 V / 5 mA at the top down to 50 µV / 50 nA at the bottom, so the same generator serves both power devices and delicate small-signal parts.
- Offset biases the step stack: ±2 V as standard, extensible to ±10 V with an optional modification — which matters for JFETs that need a gate voltage beyond about −5 V to reach pinch-off. Offset can also be switched off entirely.
- Polarity (N or P) sets the direction of the steps for N-type versus P-type devices.
1.6.3 The sweep
The main-terminal voltage is swept by a triangle waveform whose frequency is adjustable from about 140 Hz to 650 Hz. The triangle sweeps the device up and back down each cycle, so the curve is retraced continuously and appears as a steady line on the scope. Vol 2 opens up how the sweep-and-step engine is built; the number to carry forward is that this is a low-frequency, line-rate-ish analog sweep, not a fast pulse.
1.6.4 Power, size and the reservoir
The instrument runs from 230 V mains and is frugal: roughly 250 mA / ≈12.5 W at idle, rising to about 340 mA / ≈53 W at maximum load. It lives in a plastic enclosure of about 25 × 18 × 8 cm and weighs around 2.5 kg.
One detail is worth getting exactly right, because it is easy to garble: the reservoir that absorbs range-switching transients on the highest supply range is not a single high-voltage electrolytic. For the 200 V range Versteeg uses two 1,000 µF / 100 V (85 °C) electrolytics wired in series, which gives a combined working voltage of about 200 V at roughly 500 µF effective capacitance. It is a series pair sized for the 200 V envelope — not a “250 WVDC” single cap.
1.7 How it shows you the curves
The instrument produces its two analog outputs on two output jacks (X and Y): X, proportional to the voltage across the device, and Y, proportional to the current through it (developed across a current-sense shunt and buffered by the Y amplifier). Set an analog CRT scope or a DSO to X-Y mode, feed X and Y in, and the beam traces the device’s I-V characteristic in real time — one continuous line for a two-terminal part, or a fan of lines (one per step) for a three-terminal part.
The DUT itself connects through 2 mm connectors at the panel. Because a curve tracer’s drive lines can run long leads out to a device in a socket, the base/gate drive path carries a series inductor to suppress oscillation, with optional small (<100 pF) capacitors to ground; later revisions also added a 12 V protection Zener and changed one resistor (R146 to 1k8) to cure EMI and oscillation seen with long DUT leads. These are the kinds of hard-won fixes that come out of a design being built by more than one person and fed back into the public files.
1.8 Where it sits on this bench
Within the Curve Tracers category the VBA is the semiconductor / component tool, opposite the tube tracers — the uTracer6 and uTracer NXT (DIY, pulsed-HV) and the eTracer (commercial, pulsed-HV) — which trace vacuum tubes and lean on a host PC to plot. Against the vintage semiconductor tracers, the Tektronix 575/576/577 iron and the Heathkit IT-3121, the VBA offers comparable everyday measurement capability in a modern, buildable, fully documented package — at the cost of supplying your own scope as the display.
Its honest limits are the flip side of its envelope: the 2 A ceiling caps high-current work, the 200 V ceiling caps high-voltage breakdown tests (and is nowhere near enough for vacuum tubes — that is what the tube tracers on this bench are for), the standard ±2 V offset restricts some JFET work unless the ±10 V mod is fitted, and low-level precision is bounded by the noise floor of whatever scope you attach. None of that is a surprise for a hobby-cost, open-source build; the design states these limits outright rather than papering over them.
That is what the VBA is: an open, fully analog, scope-displayed component curve tracer, built from four PCBs, named for the three people who made it, benchmarked against the Tek 577 without pretending to be one. Vol 2 opens the lid on how the sweep-and-step engine actually works; Vol 3 covers building it from the published files; Vol 4 is the operator’s guide to reading the curves it draws.